I assume your data is not showing up in Prometheus? If you’re getting a specific error in the Prometheus container, please share that.
Some items stand out to me:
I would recommend not editing the originalprometheus.yml file. This will prevent upgrades. Instead, create a new file (maybe textit-scrape.yml) and then mount it inside the container. Please see our Integration docs for an example of this, specifically the Scrape Config section. It tells you exactly how to do this very task.
You’ll need to ensure you specify the correct targets: value, pass in basic_auth and specify the https scheme. I can’t tell for sure, but your textit-scrape.yml might look like:
Note that you have targets as https://textit.com/ when I think you need as I have it above https://textit.com/mr/org/501cdde5-7024-4118-b305-554d7175a5e1/metrics
i tried the mount under volumes for the prometheus service ie ./textit/config/textit-scrape.yml:/etc/prometheus/scrape_configs/textit-scrape.yml:ro but it does not work properly , how do mount this in the container?
Create a new scrape config Done! see textit-scrape.yml above
Create a compose file which you can add on in the docker compose up call. Its only job will be to extend the prometheus service and mount your file from step 1. It might be called mount-textit-config.yml and look like this:
thanks @mrjones i followed step 2 and when it came to step 3 with running docker compose -f docker-compose.yml -f ./mount-textit-config.yml up -d i got
cliff@cliffs-MBP cht-watchdog % docker compose -f docker-compose.yml -f ./mount-textit-config.yml up -d
[+] Running 2/3
 ⠿ Container cht-watchdog-json-exporter-1  Star...                                          0.4s
 ⠿ Container cht-watchdog-prometheus-1     Startin...                                       0.4s
 ⠿ Container cht-watchdog-grafana-1        Started                                          0.4s
Error response from daemon: Mounts denied:
The path /root/textit-scrape.yml is not shared from the host and is not known to Docker.
You can configure shared paths from Docker -> Preferences... -> Resources -> File Sharing.
See https://docs.docker.com/desktop/mac for more info.
So i changed volumes path in the mount-textit-config.yml file from - /root/textit-scrape.yml:/etc/prometheus/scrape_configs/textit-scrape.yml:ro to use the relative path - ./textit/config/textit-scrape.yml:/etc/prometheus/scrape_configs/textit-scrape.yml:ro
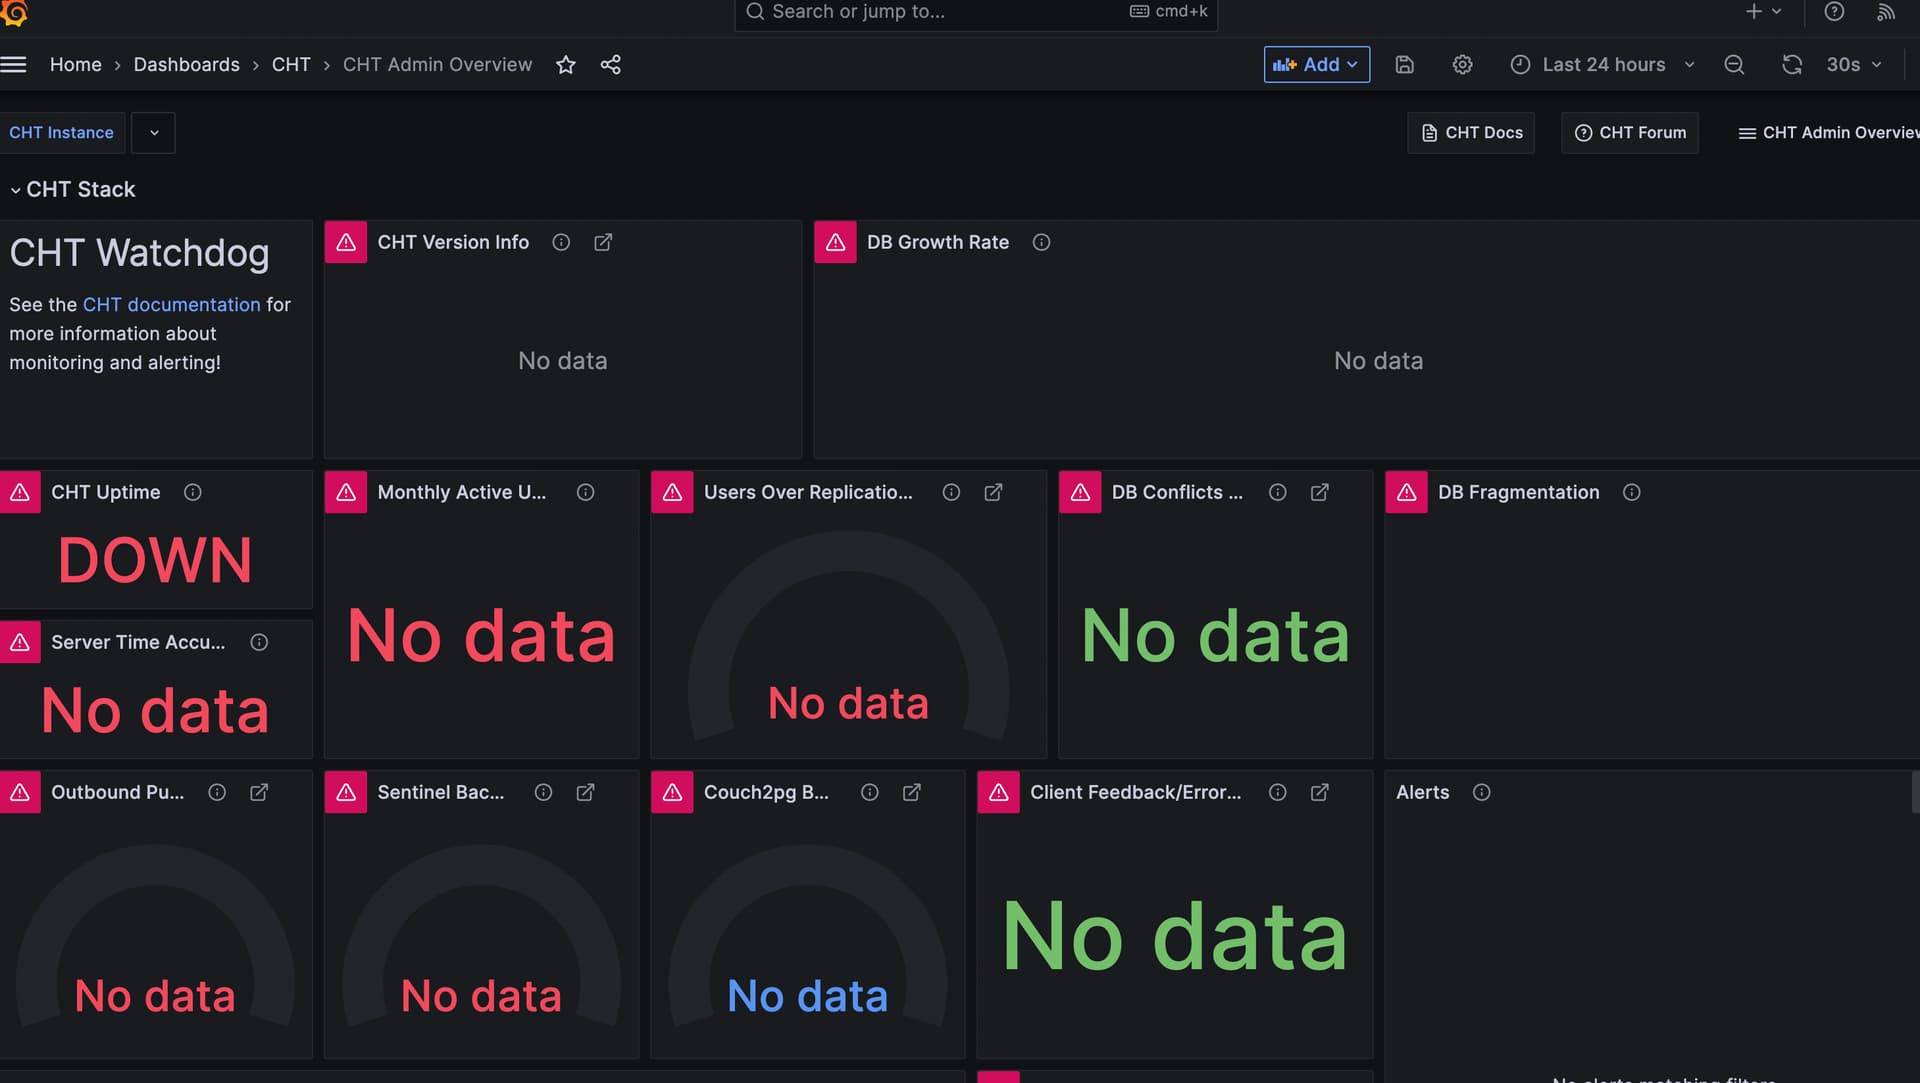
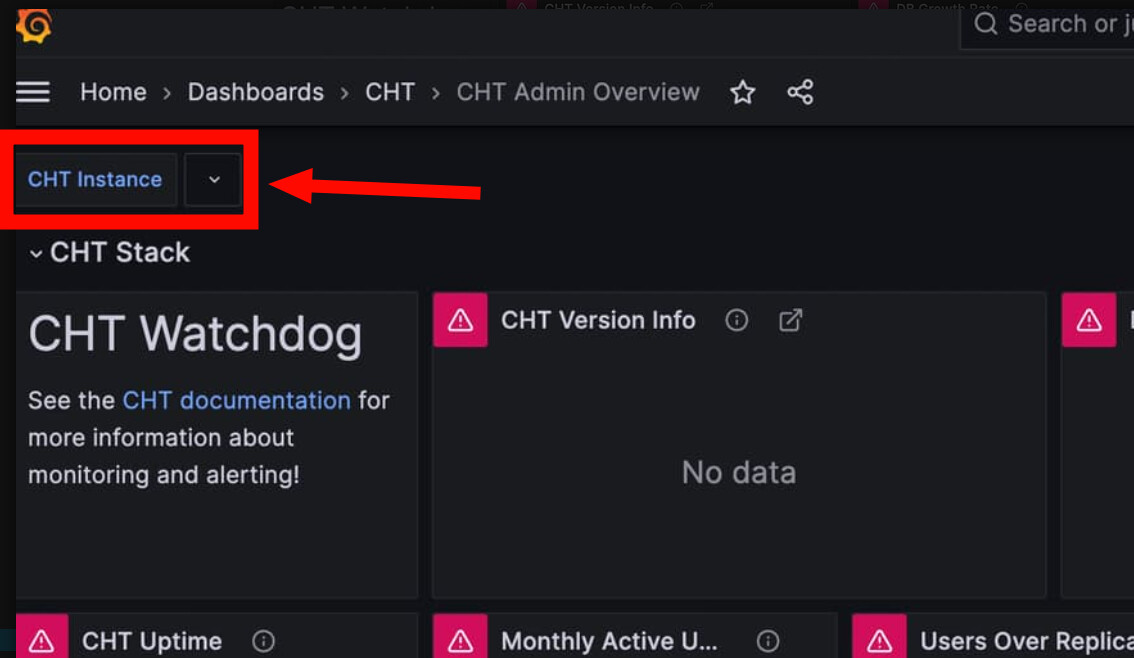
This can actually cause Grafana to load an empty dashboard. I’ve made a short video reproducing this error as well as the fix, which is to select your instance in the drop down:
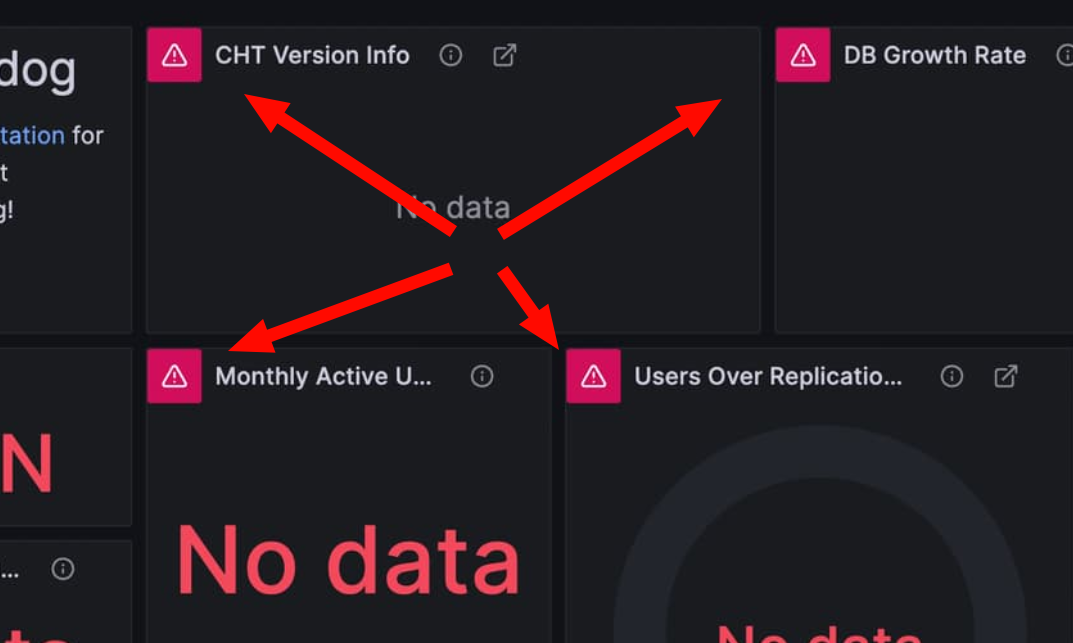
Further, can you ensure there’s no errors output from the docker logs? I noticed the warning triangles in your screenshot (see below), which may indicate that the metrics are having trouble making it from CHT → JSON Exporter → Promethous → Grafana:
You can check for errors against all containers with docker compose logs or you can check for specific containers with docker logs CONTAINER_NAME. You can view all container names and their status (uptime or restarting etc) with docker ps --format '{{.Names}}{{.Status}}'
i have investigated the logs from the container logs from prometheus and it displays ts=2023-06-22T17:09:59.765Z caller=main.go:487 level=error msg="Error loading scrape config files from config (--config.file=\"/etc/prometheus/prometheus.yml\")" file=/etc/prometheus/prometheus.yml err="\"/etc/prometheus/scrape_configs/textit-scrape.yml\": yaml: unmarshal errors:\n line 1: field global not found in type config.ScrapeConfigs\n line 10: cannot unmarshal !!map into []*targetgroup.Group"
looks like its the issue from the mounting oof volumes at - ./textit/config/textit-scrape.yml:/etc/prometheus/scrape_configs/textit-scrape.yml:ro
@cliff - yay! Happy to hear that you’ve resolved the issue with the error.
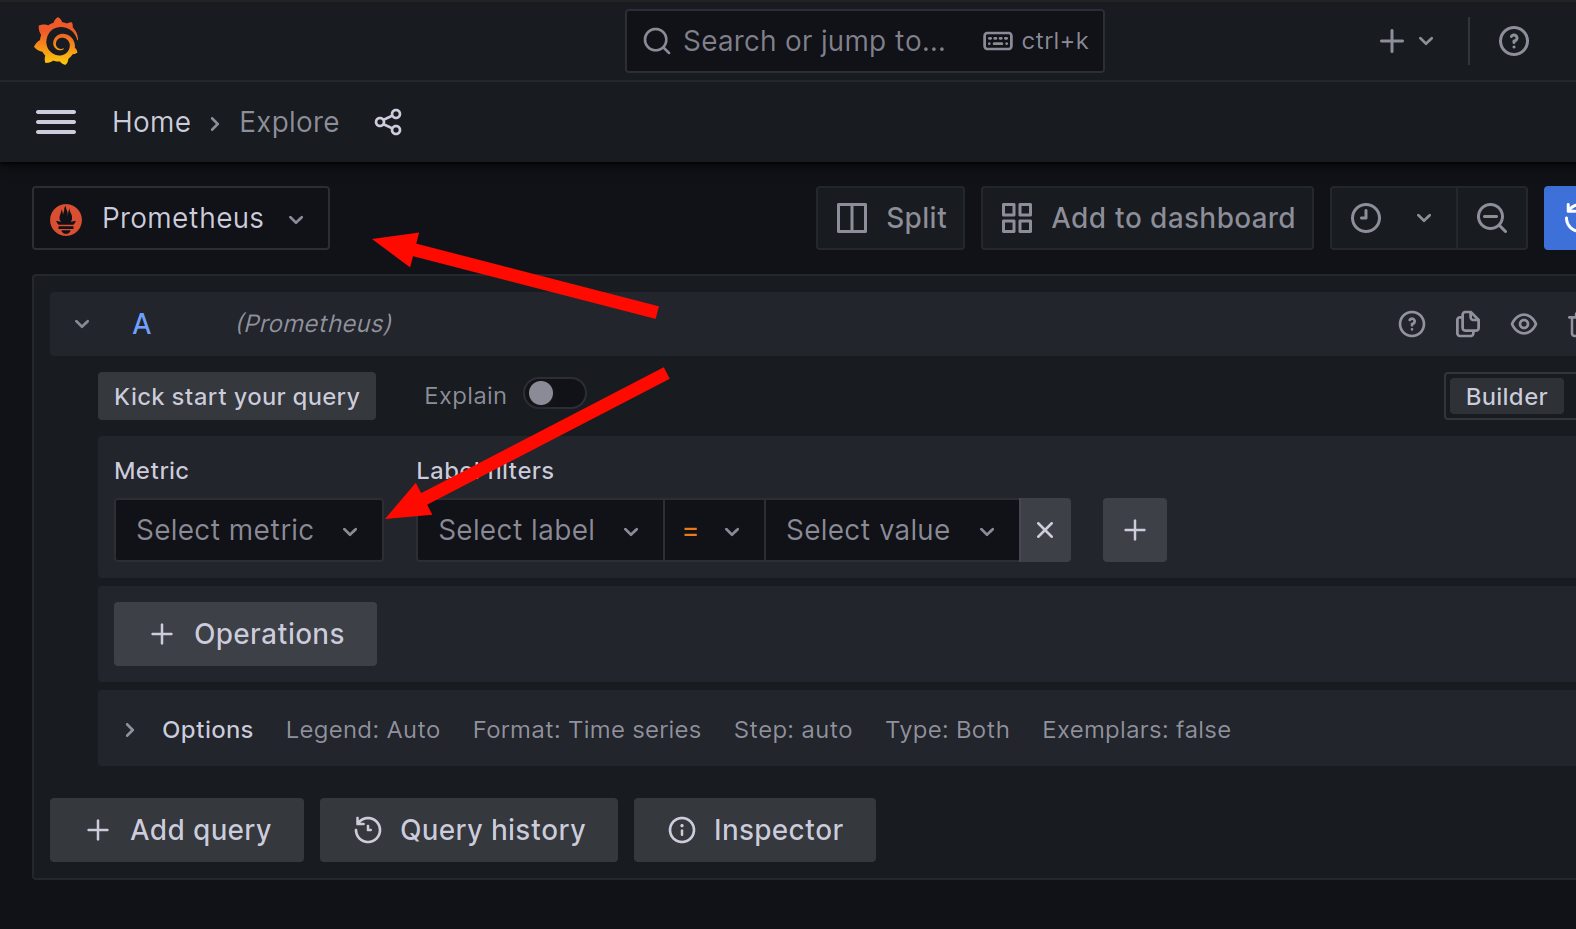
At this point you need to explore the data sources that are available to Grafana now that Prometheus has the data in the database. Having never set this up, I can’t give too much information on this. I would for sure checkout this blog post which as a few tips. After that, check out the Explore section (/explore URL on your watchdog instance). On that page, see the data source (upper left) and the metric (middle left) per the two arrows here:
From there you’ll have to build your own panels and add them to a dashboard.
Ideally you could publish this for others to use on Grafana as there’s no results for textit today! If there were an existing dashboard, it’d be very easy for you, as seen on the cAdvisor instructions.
on trying to restart the containers, i get ts=2023-06-28T08:09:47.627Z caller=main.go:487 level=error msg="Error loading scrape config files from config (--config.file=\"/etc/prometheus/prometheus.yml\")" file=/etc/prometheus/prometheus.yml err="\"/etc/prometheus/scrape_configs/texit-scrape.yml\": \"https://textit.com/mr/org/301cdde5-7024-4118-b305-554d7175a5f1/metrics\" is not a valid hostname"
i contacted the textit team and they say its a configuration issue this side
Sorry, it looks like I led you away from the correct way to do this with the targets: value. Checking the Prometheus docs, I see you need to additionally set a metrics_path. I think that would look like this, but you may need to do some minor changes to get it to work:
hello @mrjones , i run the above configuration and it displays ts=2023-06-30T09:20:43.439Z caller=main.go:487 level=error msg="Error loading scrape config files from config (--config.file=\"/etc/prometheus/prometheus.yml\")" file=/etc/prometheus/prometheus.yml err="\"/etc/prometheus/scrape_configs/textit-scrape.yml\": yaml: unmarshal errors:\n line 1: field global not found in type config.ScrapeConfigs"
i could not exec into the prometheus terminal with docker exec -it cht-watchdog-prometheus-1 bash
to look into /etc/prometheus/scrape_configs/textit-scrape.yml since the container is in the restarting status
Ah - I see I’ve made yet another mistake - my apologies! I used \ s instead of 's on the metrics_path line. Should be an easy fix to change it to this:
thanks @mrjones , wishing you the best of your time away
the "Error loading scrape config files from config (--config.file=\"/etc/prometheus/prometheus.yml\")" file=/etc/prometheus/prometheus.yml err="\"/etc/prometheus/scrape_configs/textit-scrape.yml\": yaml: unmarshal errors:\n line 1: field global not found in type config.ScrapeConfigs"
still persists with that change .
I see in the logs tracing from this line though i havent made any changes to it ,
my volumes mount config is
I can’t reproduce this error locally and promtool confirms your config file is valid syntax
Checking ./textit-scraper.yml
 SUCCESS: ./textit-scraper.yml is valid prometheus config file syntax
I noticed the error message mentions the empty global property on line 1. It seems to not do much, have you tried removing it? The config file would then look like this: