One of our big goals this year is to improve the performance of the CHT for health workers as they interact with their apps. There are many variables that can affect performance of the app: complexity of configuration, amount of data on the device, and the specs of the device itself, to name a few.
One of our first steps towards improving app performance was by making it easier to measure and evaluate performance across the entire app. We did this by improving the telemetry system in two ways:
- we added telemetry to more areas of the app; and
- we included an apdex score on several pages
Apdex is a measurement of a user’s level of satisfaction based on the response time of requests when interacting with an application. This article gives a good overview of what apdex is and how it is calculated. But the end result is that we are able to calculate a “Score” for a given page or interaction, and have a framework for how that score can be interpreted.
(NOTE: apdex improvements are in 4.7.0)
Evaluate app performance using apdex
Scenario: We set up a test server with these new features and ran automated tests that simulated user interactions on actual devices. Then we looked at the telemetry records for all of the interactions and displayed these in a dashboard.
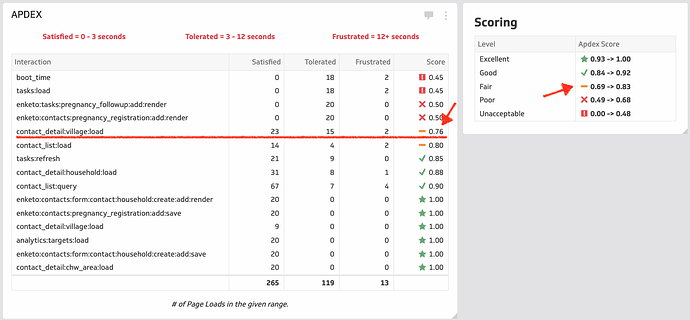
Example: In the screenshot below, let’s look at contact_detail:village:load. This is recorded whenever the detail view of the Contact Page loaded a “village” (the contact_type, which is dependent on your configuration).
Results ![]()
- In our testing scenario, users loaded the village screen 40 times (23 + 15 + 2)
- 23 of those 40 times, the response time was < 3 seconds
- 15 of those 40 times, the response time was between 3 and 12 seconds
- 2 of those 40 times, the response time was more than 12 seconds
- Based on this, our apdex score for this page is calculated to be 0.76
- 0.76 evaluates to having a “Fair" score
With these scores, we have some concrete data to understand where users are most often experiencing slowness and where we might want to focus our efforts. In a subsequent post, I’ll highlight how we are already using this data to inform decisions.
