Proposal: Storage Pressure Indicator for Offline Users
Would there be interest in including a storage pressure indicator for offline users? This could be especially useful for devices operating in kiosk mode, where users don’t have direct access to system storage information.
While troubleshooting replication issues and unexpected browser crashes on lower-end devices, we developed a simple “storage pressure bookmark” to better understand what was happening. However, this approach wasn’t user-friendly.
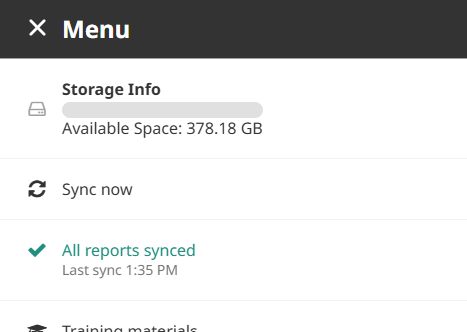
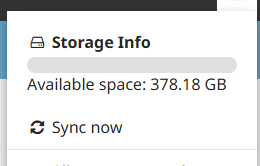
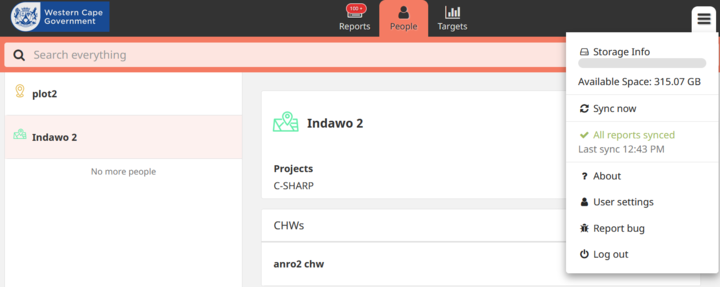
To make it more accessible, we built an in-app display that allows users to see, at a glance, whether storage limitations might be causing performance issues or if purging isn’t working as intended.
How It Works
We integrated this functionality into the header component by periodically retrieving storage estimates using the navigator.storage.estimate() API:
storageInfo: string = 'Calculating...';
storageUsagePercentage: number = 0;
intervalId: any;
isUpdating: boolean = false;

...

ngOnInit(): void {
    ...
    this.updateStorageInfo();
    this.intervalId = setInterval(() => this.updateStorageInfo(), 30000);
}

ngOnDestroy() {
    ...
    if (this.intervalId) {
        clearInterval(this.intervalId);
    }
}

...

async updateStorageInfo(): Promise<void> {
    if (this.isUpdating) return;

    this.isUpdating = true;
    try {
        const estimate = await navigator.storage.estimate();
        const availableGB = ((estimate.quota! - estimate.usage!) / 1024 / 1024 / 1024).toFixed(2);
        this.storageUsagePercentage = (estimate.usage! / estimate.quota!) * 100;
        this.storageInfo = `Available Space: ${availableGB} GB`;
    } catch (error) {
        this.storageInfo = 'Error retrieving storage information.';
        console.error('Storage estimate failed:', error);
    } finally {
        this.isUpdating = false;
    }
}
Why Is This Important?
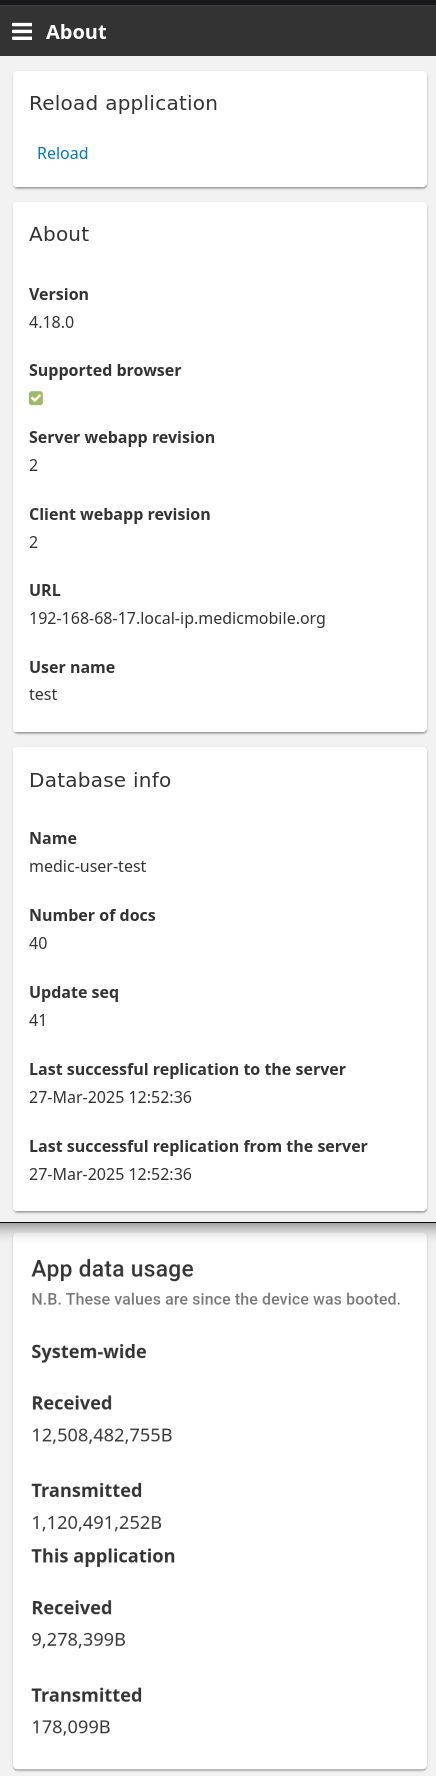
While a device may appear to have sufficient storage, what the browser allocates to the app is not the same as total device storage. This distinction might be important for web apps running in offline mode, particularly when using PouchDB for local storage and replication.
In kiosk environments, where users can’t manually check storage, this indicator could be a useful troubleshooting tool for explaining slow performance, failed replications, or unexpected app terminations.
Browser Support & Considerations
The navigator.storage.estimate() API is widely supported, but there are some differences between browsers:
| Browser | Minimum Version |
|---|---|
| Chrome | 61 |
| Firefox | 76 |
| Safari | 16 (macOS Ventura, iOS 16) |
![]() Full Browser Compatibility Table
Full Browser Compatibility Table
Accounting for Browser Differences
This API, as far as I know, is designed to handle storage quota variations per browser, but it only works in secure contexts (HTTPS or localhost). If the API is unsupported, perhaps there’s a fallback that we could explore?
Would This Be Valuable for CHT?
Would other teams find this useful? Should we refine the UI/UX further?
I’m still coming to grips with browser APIs and storage, so please let me know if I’ve missed anything.
Additional info:
Storage requirement on devices for CHT - Technical Support - Community Health Toolkit
Explore and document limitations using WebView version · Issue #170 · medic/cht-android
Origin - HTTP | MDN