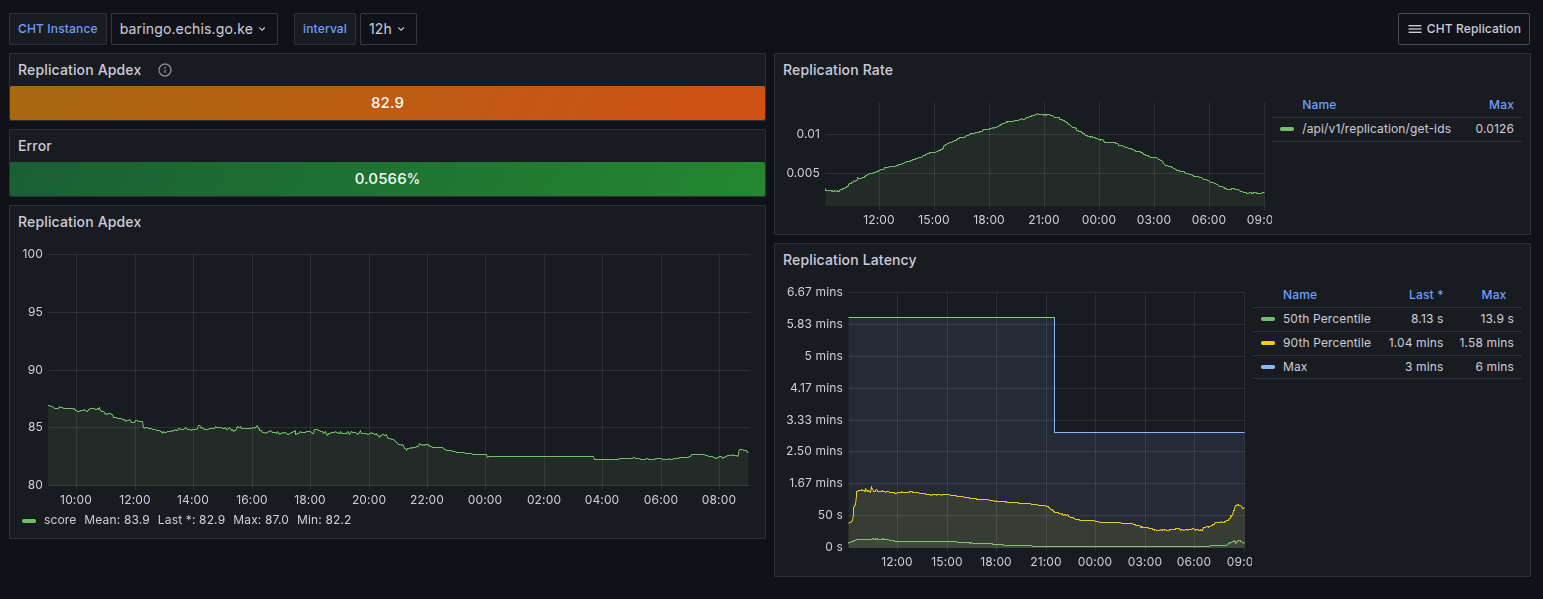
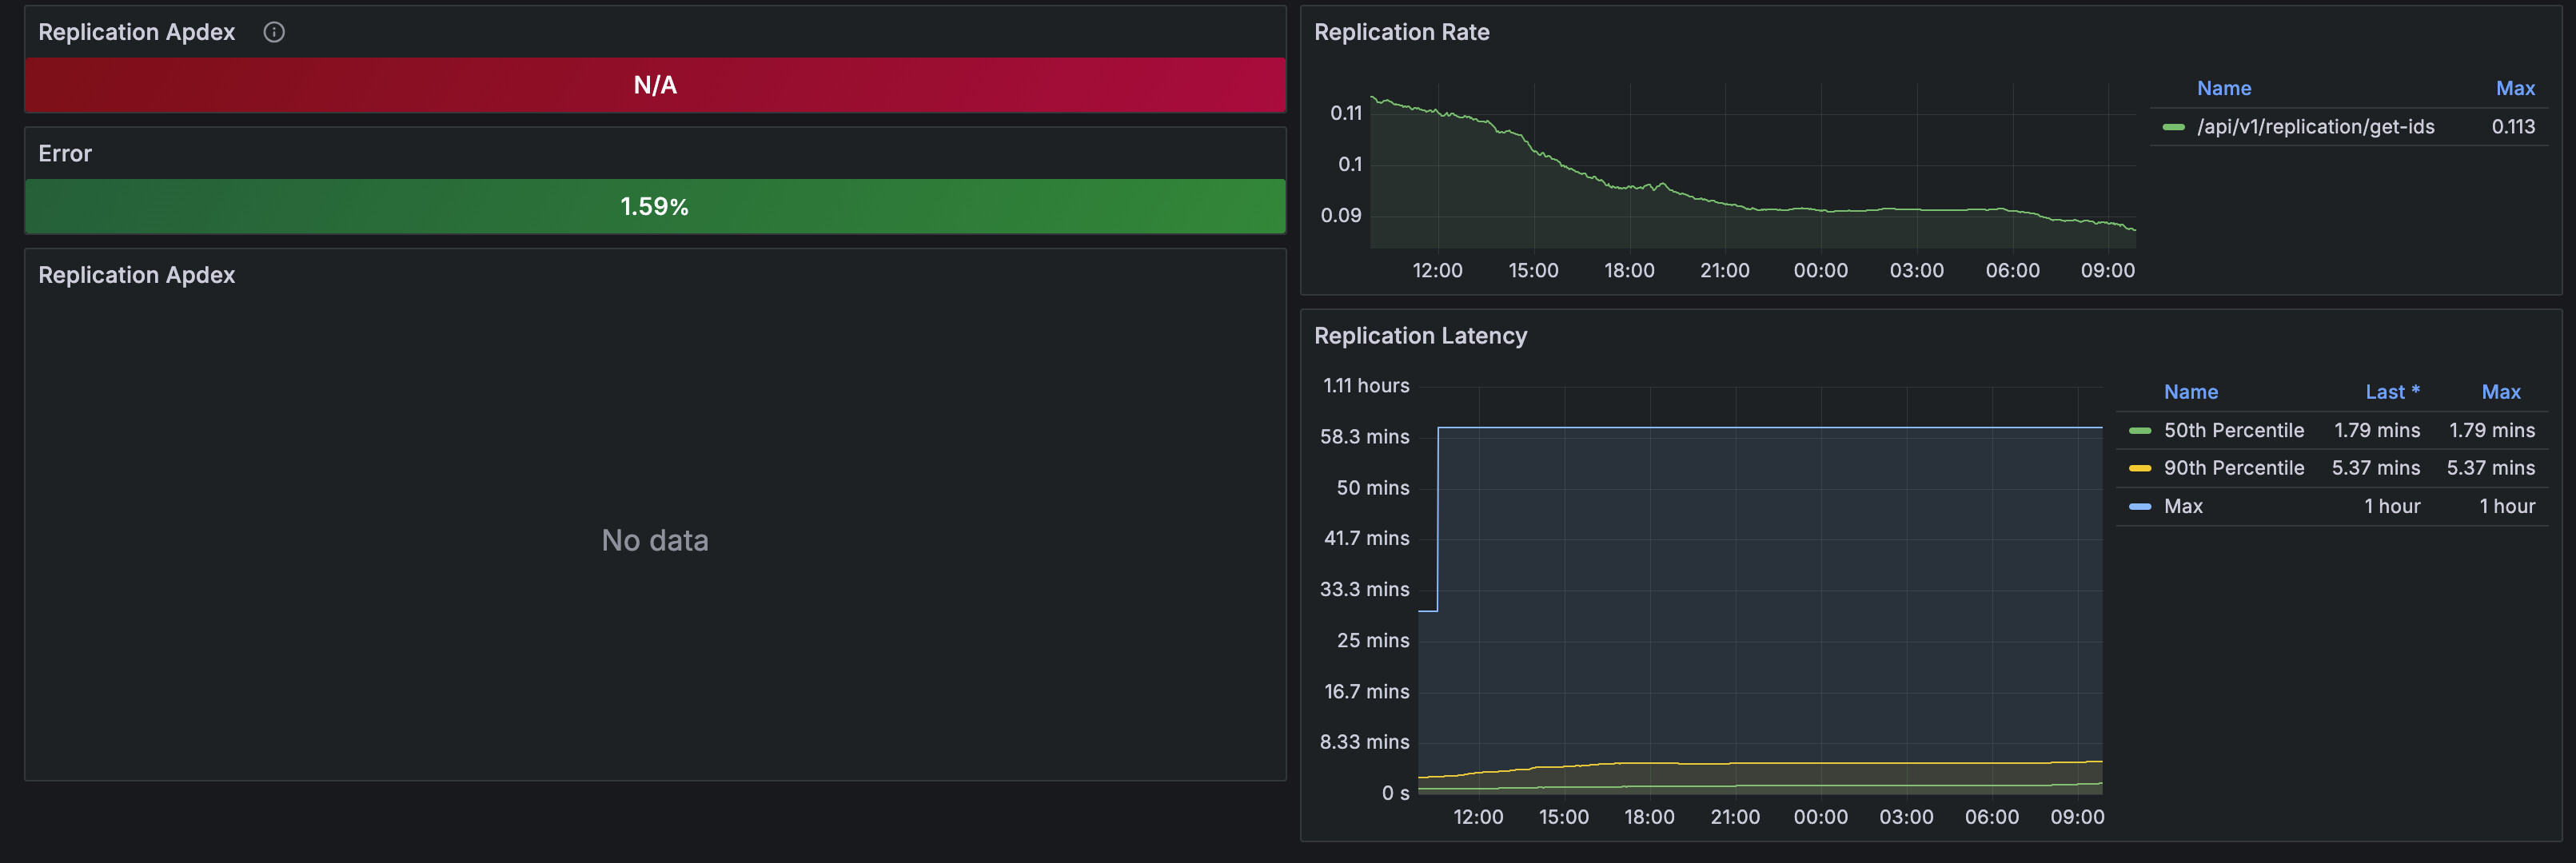
This instance has been receiving data for a couple of weeks but Replication Appdex has no value. Is this normal? Is any manual intervention needed?
Hi @derick
The data required for this dashboard is gathered through an API endpoint /api/v1/express-metrics. This endpoint is unauthenticated and should be available to be queried by watchdog.
Can you share a little more about your instance and watchdog setup?
This is from the self-hosted eCHIS watchdog.
@elijah please share more details on how watchdog was set up.
@derick sorry for late response, setup was done using this guide.
Thanks for the info @derick and @elijah! The screenshot you posted above appears to be for less than a day. Does the data show accurately if you zoom out to a larger time frame, say a few weeks?
Also, can you confirm you’re running Watchdong 1.19.1? This release includes a bug fix for this specific metric and just before that 1.19.0 includes an upgrade to Prometheus (and then a further back 1.15.0 had some major upgrades to Grafana et al.)
Thanks!