Recently I was part of team trying to figure out why users were having issues synchronizing their devices to the CHT server. CHWs would complain of long sync times, some times waiting days to download their documents or timing out all together.
What does Sentinel backlog say?
When ever I hear about an instance with performance issues, I want to know two things:
- Do you have Watchdog set up?
- If yes, can you show me the Sentinel backlog chart?
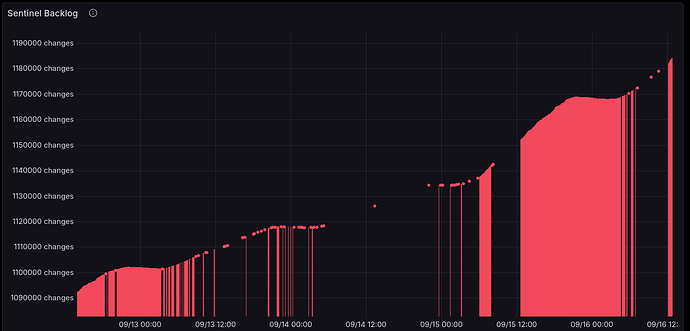
The answer was “yes” and this screenshot was shown:
Looking at this graph, there’s 3 key takeaways:
- It is only going up, never going down
- There are gaps in the data
- It is above a million documents
So while the literal meaning of Sentinel backlog is:
Number of changes yet to be processed by Sentinel. If this is persistently above 0 you may have resource contention.
Using items 1, 2 and 3 above, I can infer that this CHT system is unhealthy because the backlog is a great proxy for overall system health. Without looking further, I know the CPU is so busy it can’t keep with the new sentinel tasks that are being added. Further, when Watchdog queries the monitoring API, it sometimes fails to get back an answer at all, thus the data gaps.
To further corroborate the end user’s poor experience, we can look at the replication latency during this period at a 10 minute interval:
Note the blue Max line is frequently smashing into the upper bounds of 1 hour. We know for sure users are taking more than 1hr to sync which is horrible.
As the backlog is just a proxy and the latency just confirms what we already know, the next step will be to first quantify the resource contention and then try and figure why there’s such a high backlog and latency.
Node Exporter to monitor system level resources
Watchdog can not see outside the CHT Server. However, Node Exporter can. By deploying Node Exporter to your CHT server and then adding the integration to Watchdog (similar to how we document adding cAdvisor), we can now quantify memory, disk, network and CPU use at any time.
Deployments wanting measuring and improving performance should add system level metrics to their observability stack. It can be Node Exporter as done here, or any other system that gives the same insights. It is a troubleshooting super power to be able to see one layer below the CHT into the VM or bare-metal host.
Zooming into CPU during this time period looks like this:
The CPU is at 100% utilization for most the time, excluding a small dip on the 15th and 16th. We’ve now quantified the impact!
In hopes of a quick win, early on the morning of the 19th the RAM and CPU were more than doubled. This made slight reduction in CPU use, but replication latency was unchanged. Sentinel backlog showed a decline, but still had availability gaps and was occasionally increased:
Note how in this screenshot we’re now carefully lining up 3 disparate sources of data to gain powerful observability insights.
Quantifying users above replication limit
While trying to figure what the root cause (or at least one of the root causes - there might be more than one!!), this was hypothesized:
Look at the worst users who are over replication limit. Remember a single user with 1M docs to replicate can essentially ruin performance for everybody. Our investigation should not be focused on reducing the number of users over the limit, it should be refocused to manage the worst configured users.
To find the worst configured users, we can turn to the the /api/v1/users-doc-count endpoint. This is an authenticated API that returns JSON like this:
{
  "_id": "replication-count-mary",
  "_rev": "61-c2bbfba893db6c0fa61f774cc63d5a26",
  "user": "mary",
  "date": 1756802158059,
  "count": 33220
}
However, the JSON from the API can be a bit hard for humans to read. Further, it has the document counts for all users, not just the ones above a certain limit. A nice tabular output with just the offending users would be nice. To process the JSON, a python script was written. After saving the JSON from the API and after running the script, the result will look like this:
4,434 total, 1,234 active, 14 affected, max 254,340
| count | doc count | user name |
|---|---|---|
| 1 | 254,340 | Melisande |
| 2 | 135,700 | Kairi |
| 3 | 90,368 | Macy |
| 4 | 56,559 | Roux |
| 5 | 36,642 | Charity |
| 6 | 33,220 | Viviana |
| 7 | 31,864 | Milan |
| 8 | 28,366 | Calla |
| 9 | 25,604 | Annora |
| 10 | 18,061 | Ambrosia |
| 11 | 17,653 | Finlee |
| 12 | 16,142 | Leopoldine |
| 13 | 16,120 | Daya |
| 14 | 15,770 | Blaize |
Empowered with this data, we can now go track down these users to either disable them or otherwise re-allocate their documents.
Result of disabling users
If we go back and look at that same graph, but over the past 5 days, we can see the tail end of the negatively impacted period ending on on the 17th. The 18th onward shows a very happy CHT server:


