@Patrick_K ,
Before we getting to more Kibana info, I wanted to mention the technical way to correlate public IPs of user logins to the data being sent to the CHT. With our Docker set up, we deploy an instance of ngnix in the medic-os container which acts as a reverse proxy to terminate TLS connections (one of two reverse proxies when you count HAProxy). This means nginix is the only server to log the public IP of the user, while HAProxy logs all the raw data of activities themselves.
Here’s how you would find all the successful logins from ngnix’s perspective, again assuming your container name is medic-os_1. We’ll grep against the /srv/storage/medic-core/nginx/logs/access.log in the medic-os container and check for a redirect 302 response:
docker exec -it medic-os_1 grep 'POST /medic/login' /srv/storage/medic-core/nginx/logs/access.log|grep 302
Going back to HAProxy’s log, if you found this event in the haproxy container that you wanted to find the public IP for:
Apr 22 18:03:07 98dc12562bd1 haproxy[25]: 172.18.0.3,401,POST,/_session,-,admin,'{"name":"admin","password":"***"}',390,3,67,'-'
You would take the exact time Apr 22 18:03:07 and convert it to ngninx’s format of 22/Apr/2022:18:03:07 and search in the medic-os conatiner like so:
docker exec -it medic-os_1 grep 'POST /medic/login' /srv/storage/medic-core/nginx/logs/access.log|grep '22/Apr/2022:18:03:07'

192.168.108.8 - - [22/Apr/2022:18:03:07 +0000] "POST /medic/login HTTP/1.1" 401 25 "https://192-168-108-17.my.local-ip.co:8443/medic/login" "Mozilla/5.0 (Linux; Android 9; Pixel 2 Build/SP2A.012; wv) AppleWebKit/537.36 (KHTML, like Gecko) Version/4.0 Chrome/493.0.78 Mobile Safari/36 org.medicmobile.webapp.mobile/v0.11.0-webview"
In this case we see only an unroutable RFC1918 IP of 192.168.108.8, as this isn’t on the public internet, but on my test LAN.
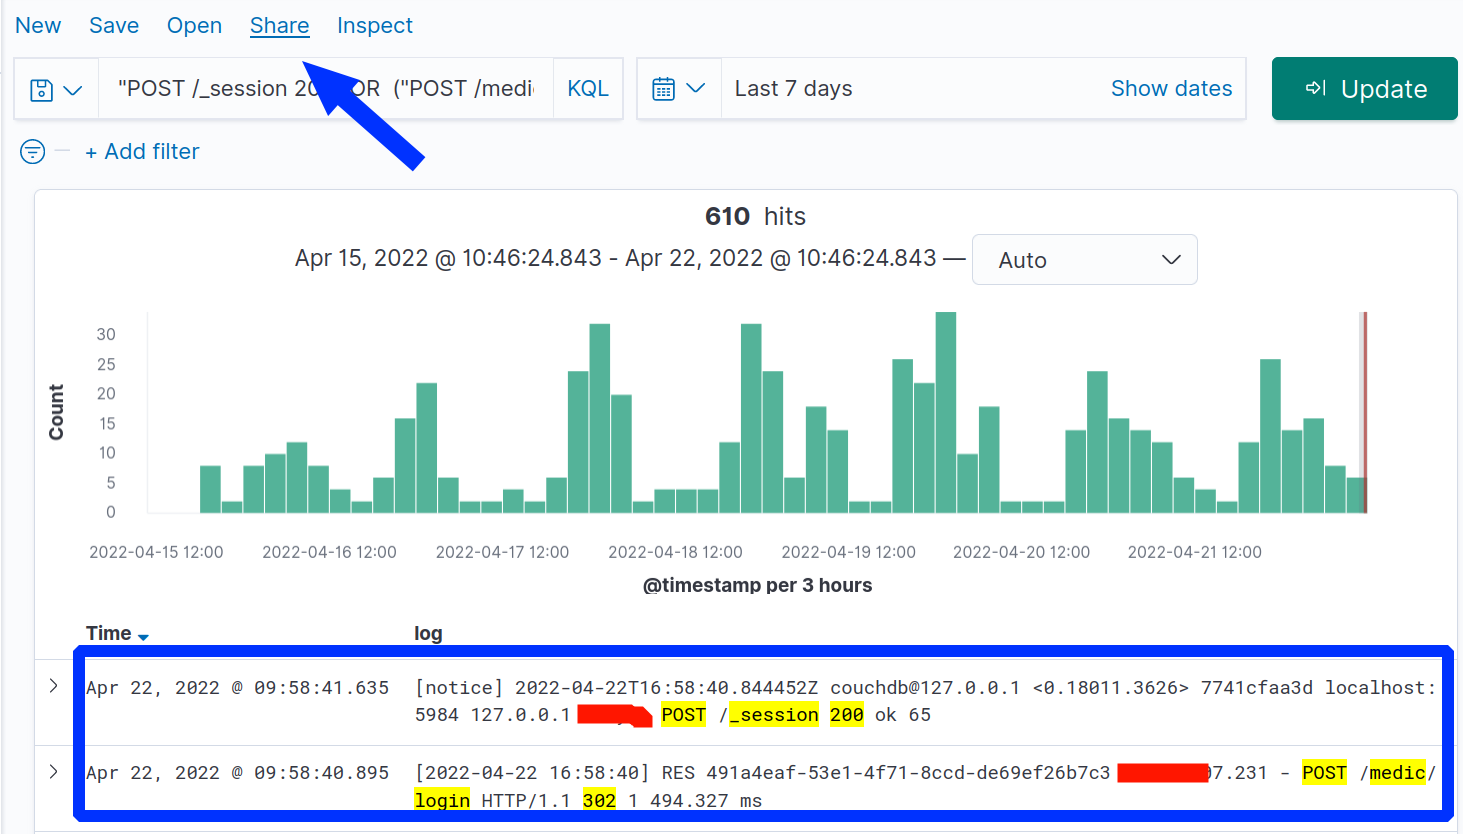
Getting back to deploying Kibana (which in turn uses Elesticsearch as a storage/search engine). you have to set it up and ensure it is indexing all your logs, including HAProxy and ngnix. Then, continuing our example of auditing for successful logins, you would search across BOTH HAProxy and ngnix with a search of ("POST /_session 200") OR ("POST /medic/login" and 302). You get a nice histogram of events correlating to diurnal patterns which is great for seeing anomalous event spikes. The square on the bottom highlights the same login event across HAProxy and ngnix (username and IPs redacted in red):
Note the arrow at the top of this screenshot showing Kibana’s “Share” feature. This allows a system administrator to build up a series of complex searches and then simply share deep links. Each link could show what ever you want like, from “successful logins for past 10 days” to “Forms submitted outside of business hours”.
The huge win of course is that within Kibana, it’s easy to drill down to verify what and when a given user did after logging in.
Two final notes:
- I mentioned Logtrail in my prior post. This is best watching live events in real time (like
tail -f ) on all your logs via a web GUI. Though it does have search feature. Kibana’s “Discover” feature, as highlighted above, is better for ad hoc log auditing.
- This information is applicable to CHT 3.x and will likely change with CHT 4.x
Best of luck and let me know if you have any questions!